Problem
I have been working with fhi360 in assisting the Government of Madhya Pradesh (MP) to implement MPHSRP (Madhya Pradesh Health Sector Reforms Program) for the last one year.
Madhya Pradesh, a state in central India has very high infant and mother mortality rates, compared to the national average. Our programme helps strengthen the system and we work closely with the Health Department, WCD (Women & Child Development) & PHED (Public Health Engineering Department) departments aiming to reduce MMR (Maternal Mortality Ratio), IMR (Infant Mortality Ratio), Malnutrition & TFR (Total Fertility Rate) in the state of Madhya Pradesh in India.
MCTS (Mother & Child Tracking System) is an online monitoring software which has been developed by Government of India with an objective to track the different services being provided/ to be provided to a pregnant mother right from conception until the baby turns a one year old.
The tracking system still needs to be worked upon further before it can be implemented.
Why we used the tool
My team mates and I used the Theory of Change, Causes Diagram in one combination and SWOT Analysis, Question Ladder and the Critical Task list in another combination (see page ..) Our aim is to strengthen the usage of the MCTS software and also re-defining roles, incentives and contingency strategies for all the people and stakeholders responsible for its functioning. We did this by using a set of tools to first re-visit and try resolving the problem at hand, and then use another set of tools to identify potential team members and create a critical pathway to implement our solution.
How we used the tool
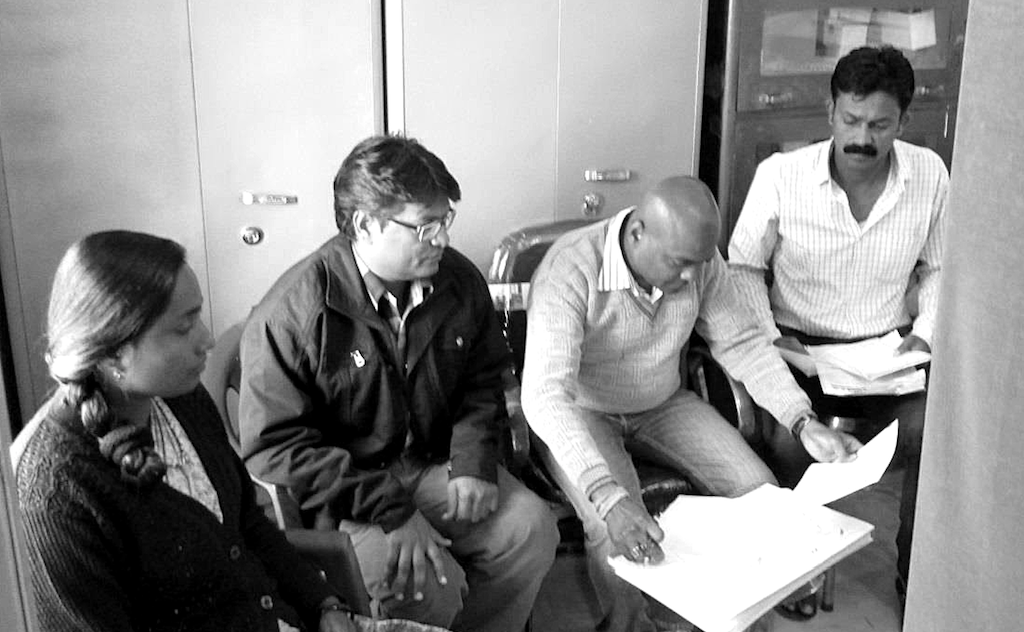
I used these tools in Jabalpur District in Madhya Pradesh as a pilot. First, I explained the purpose of doing the whole exercise to my team by helping them understand:
- exactly what is going on
- who are the people involved and what their roles are, and
- understanding the bottlenecks that we should work towards to solve the issue.
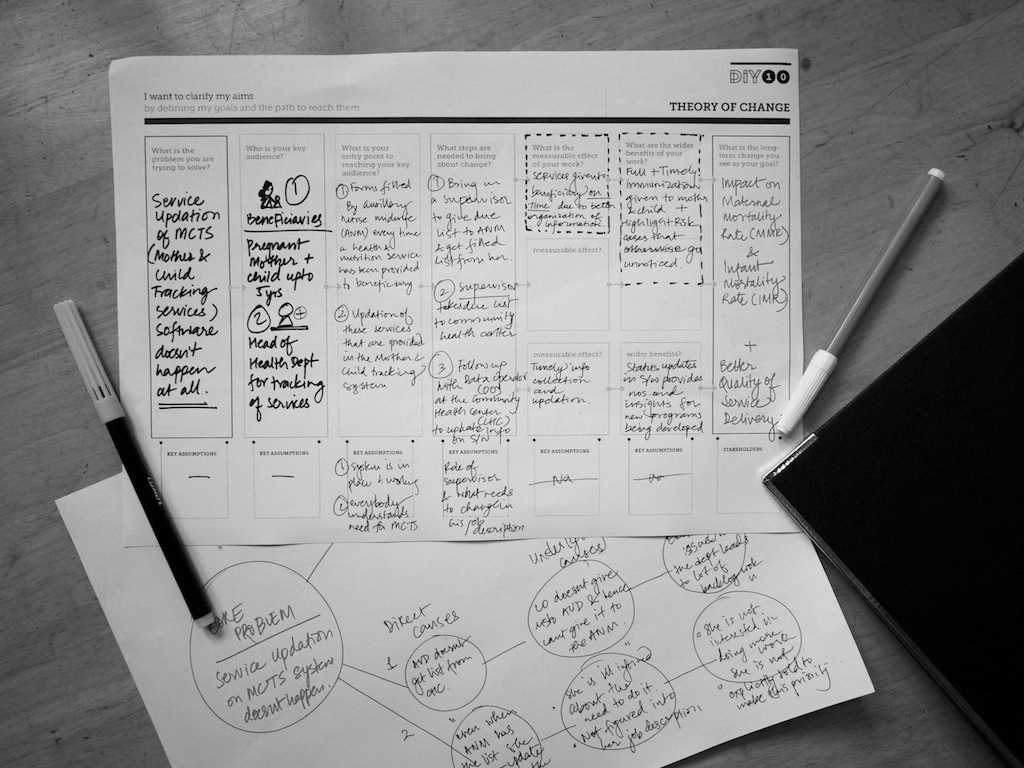
We then used a combination of Theory of Change and Causes Diagram.
Theory of Change
To give a clear idea on what is planned for change – i.e. updating the service in the MCTS system and to make the team understand how affects their routine work, how it will help the community, how it will help the Programme Manager for decision making and how it is going to impact the overall Infant Mortality Rate over a period of time.
Causes Diagram
Identify the bottlenecks which are hindering the MCTS service from updating. To learn from all the root issues and devise a better solution accordingly.
Results of using the tool
The Theory of Change tool helped the team understand that even their role as a grassroot worker can contribute to a larger change over time. This was key to achieve any success for the programme helping create an attitude change towards their work. The tool also helped iron out inefficiencies in the current system in a holistic manner.
The Causes Diagram helped the team realize that while there exists a messy array of convoluted issues, distilling it to the one or two more important and actionable problems was a better strategy. This tool helped the team understand and define the cause of current inefficiencies in a structured manner and helped them identify what to work towards to fix a core problem.